Why Table Management Is a Revenue Problem, Not a Seating Problem
Most restaurant owners think of table management as a hostess task: greet the guest, check the book, walk them to a table. That model leaves money on the table — literally. According to the National Restaurant Association, the average full-service restaurant operates at only 60–70% seating efficiency during peak hours. That means 30–40% of your revenue capacity is sitting empty, even on your busiest nights.
The problem isn't demand. It's visibility. Without real-time data on table status, course timing, and check progress, your host stand is making decisions based on gut feeling. And gut feeling doesn't optimize for revenue — it optimizes for avoiding complaints.
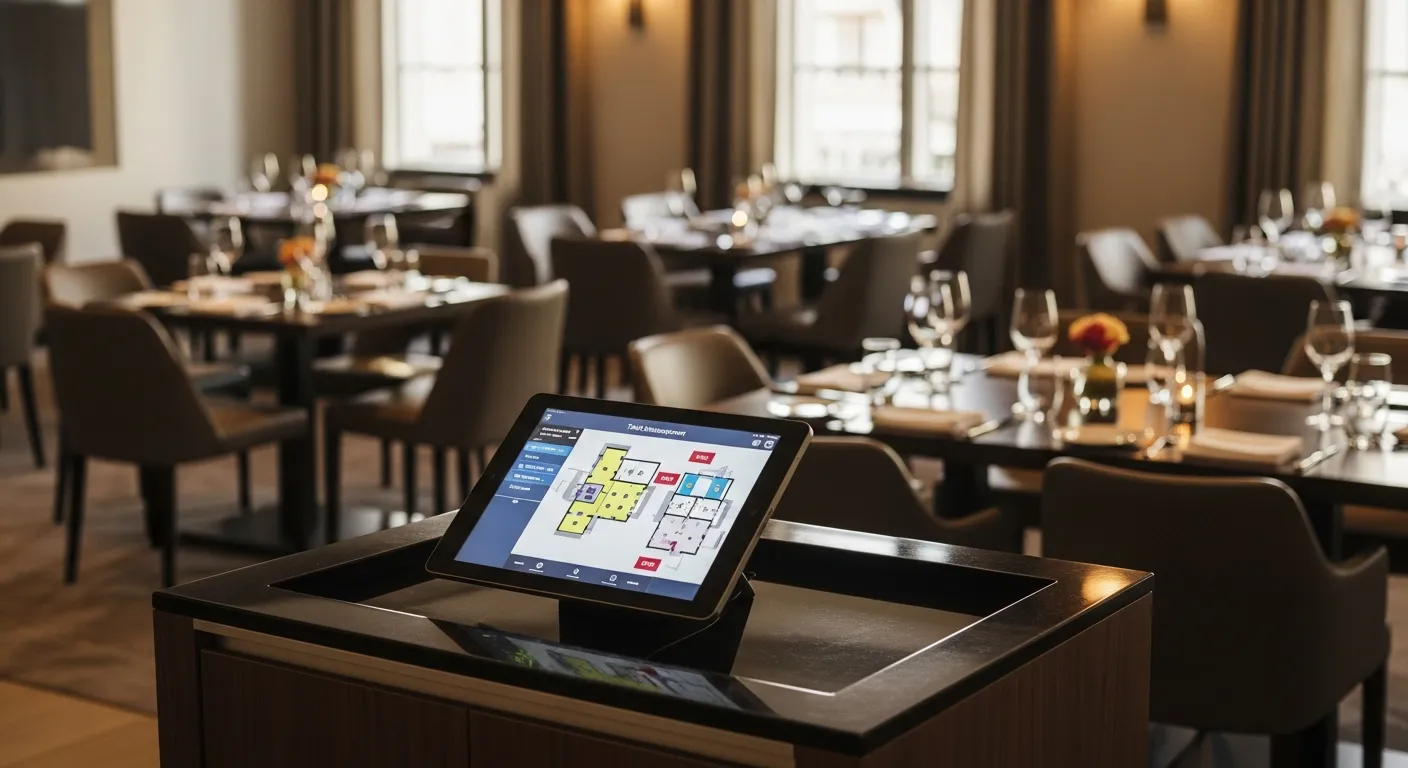
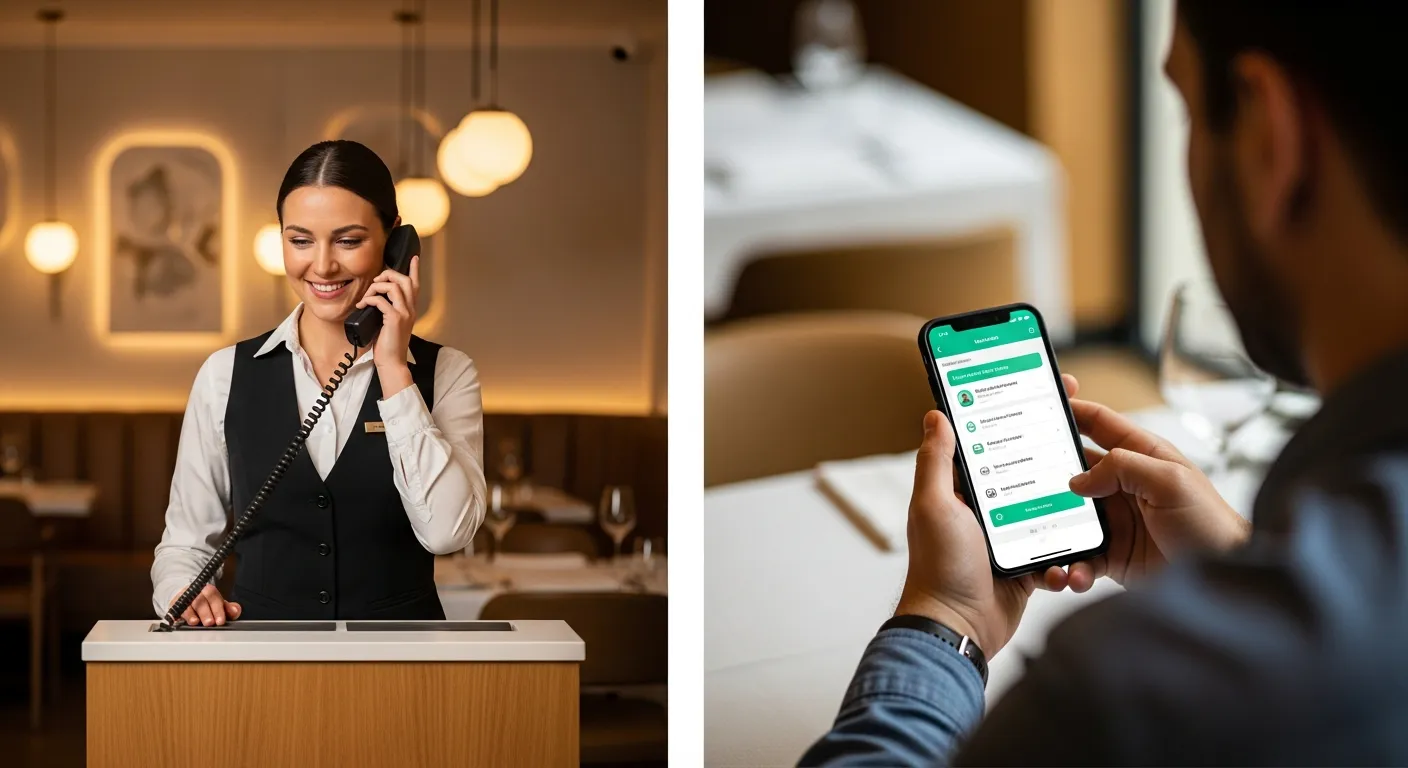
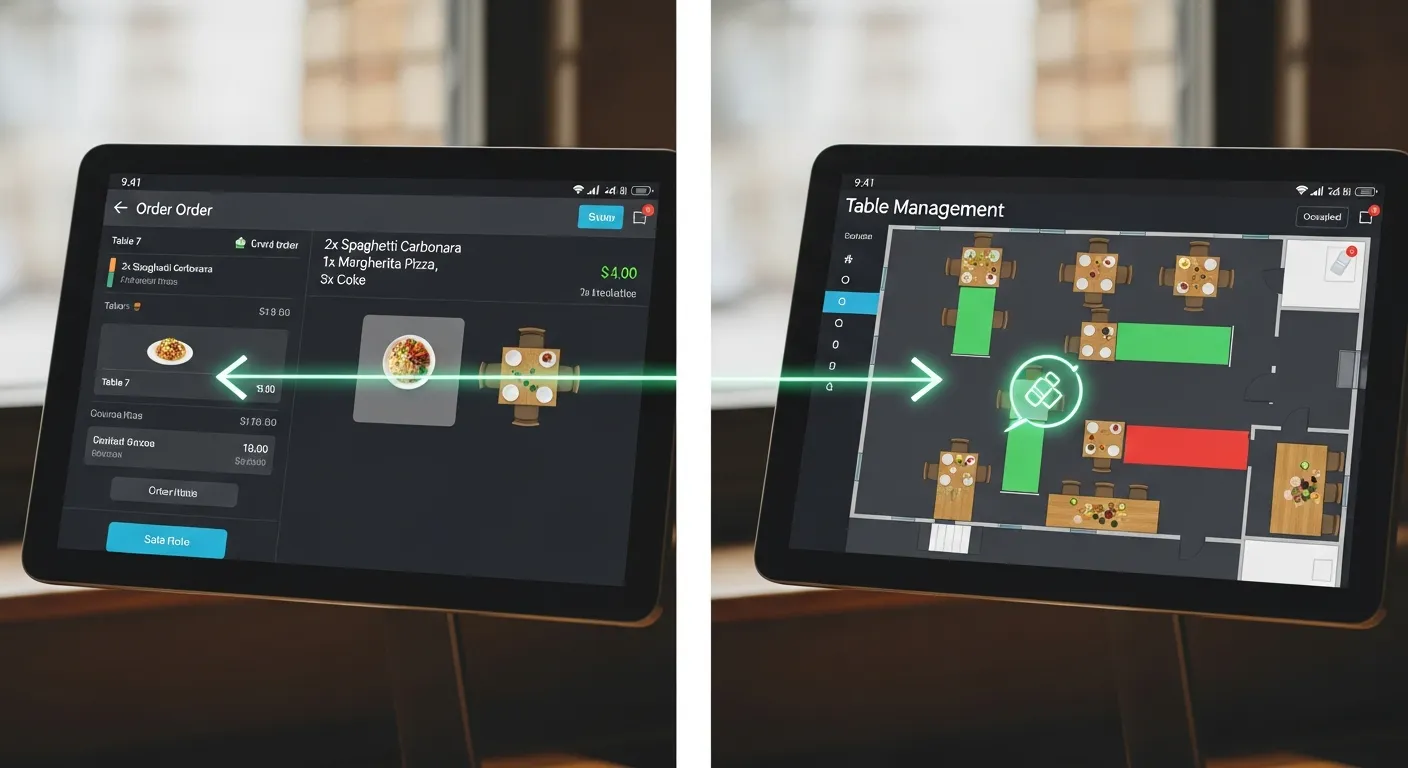
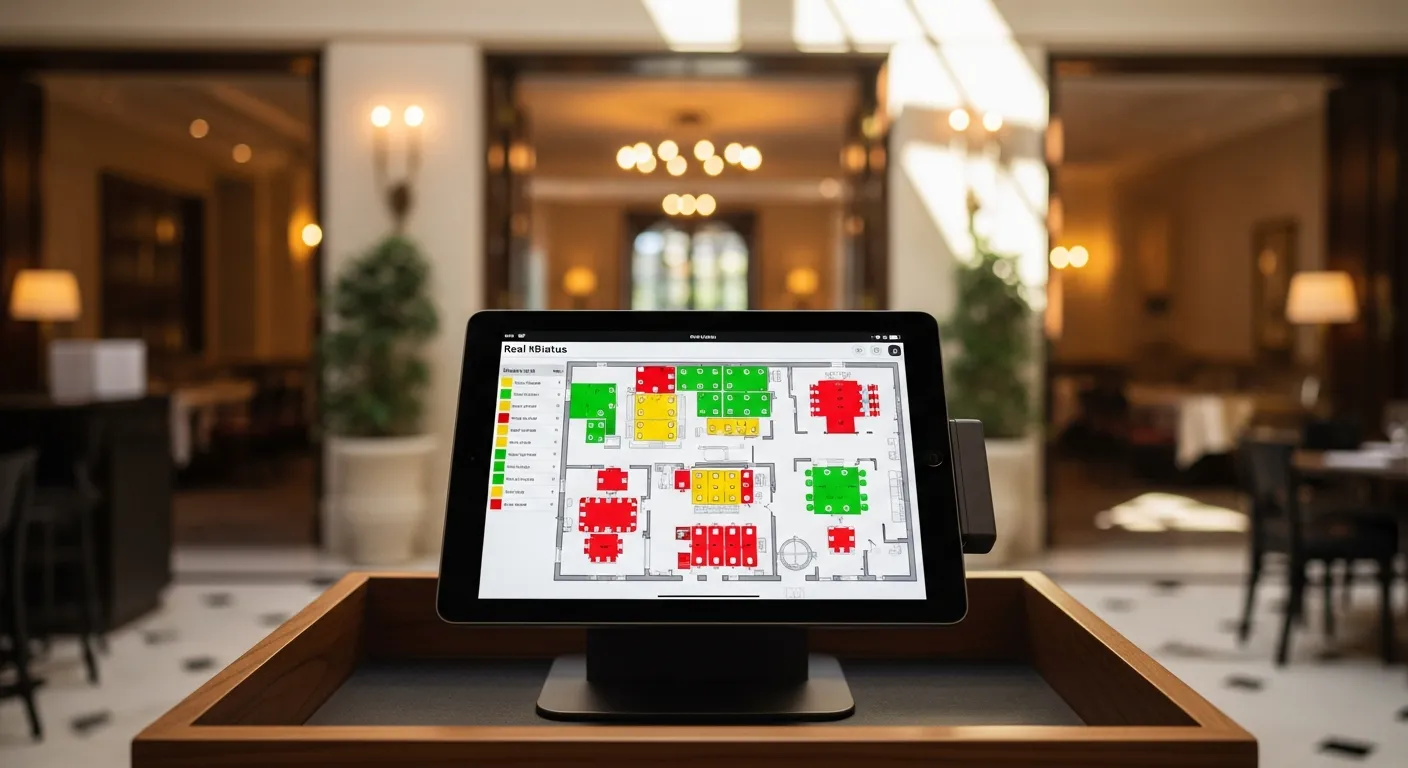
Modern table management systems change this equation. They track every table from the moment it's set to the moment it's bussed. They calculate accurate wait times based on real data, not estimates. They know that Table 14 ordered dessert and Table 7 just got their entrees, so the host can promise the next walk-in party an accurate 12-minute wait instead of a vague "about 20 minutes."
The restaurants that treat table management as a revenue optimization system — not a seating chart — consistently outperform their competitors by 15–25% in revenue per available seat hour. This guide shows you exactly how to get there.
RevPASH: The One Metric That Changes Everything
Revenue Per Available Seat Hour (RevPASH) is the single most important metric in table management. It combines two variables — how fast you turn tables and how much each table spends — into one number that tells you exactly how hard each seat is working for you.
How to Calculate RevPASH
RevPASH = Total Revenue ÷ (Number of Seats × Hours Open)
Example: A 60-seat restaurant generates $8,400 during a 5-hour dinner service.
RevPASH = $8,400 ÷ (60 × 5) = $28.00 per seat hour
That $28 number becomes your baseline. Every operational decision — reservation policy, menu engineering, server section assignments, floor plan changes — should be evaluated by whether it moves RevPASH up or down.
RevPASH Benchmarks by Restaurant Type
| Restaurant Type | Avg RevPASH | Top 10% RevPASH | Avg Turn Time |
|---|---|---|---|
| Fast Casual | $12–$18 | $22+ | 20–30 min |
| Casual Dining | $8–$14 | $18+ | 45–60 min |
| Upscale Casual | $15–$22 | $28+ | 60–75 min |
| Fine Dining | $18–$30 | $40+ | 90–120 min |
| Bar/Lounge | $10–$16 | $20+ | 35–50 min |
Notice that fast casual has a high RevPASH despite lower check averages — speed matters. Fine dining compensates for slow turns with higher spend. The worst position is casual dining with slow turns and moderate checks. That's where table management software has the biggest impact.
Table Turnover Optimization Without Rushing Guests
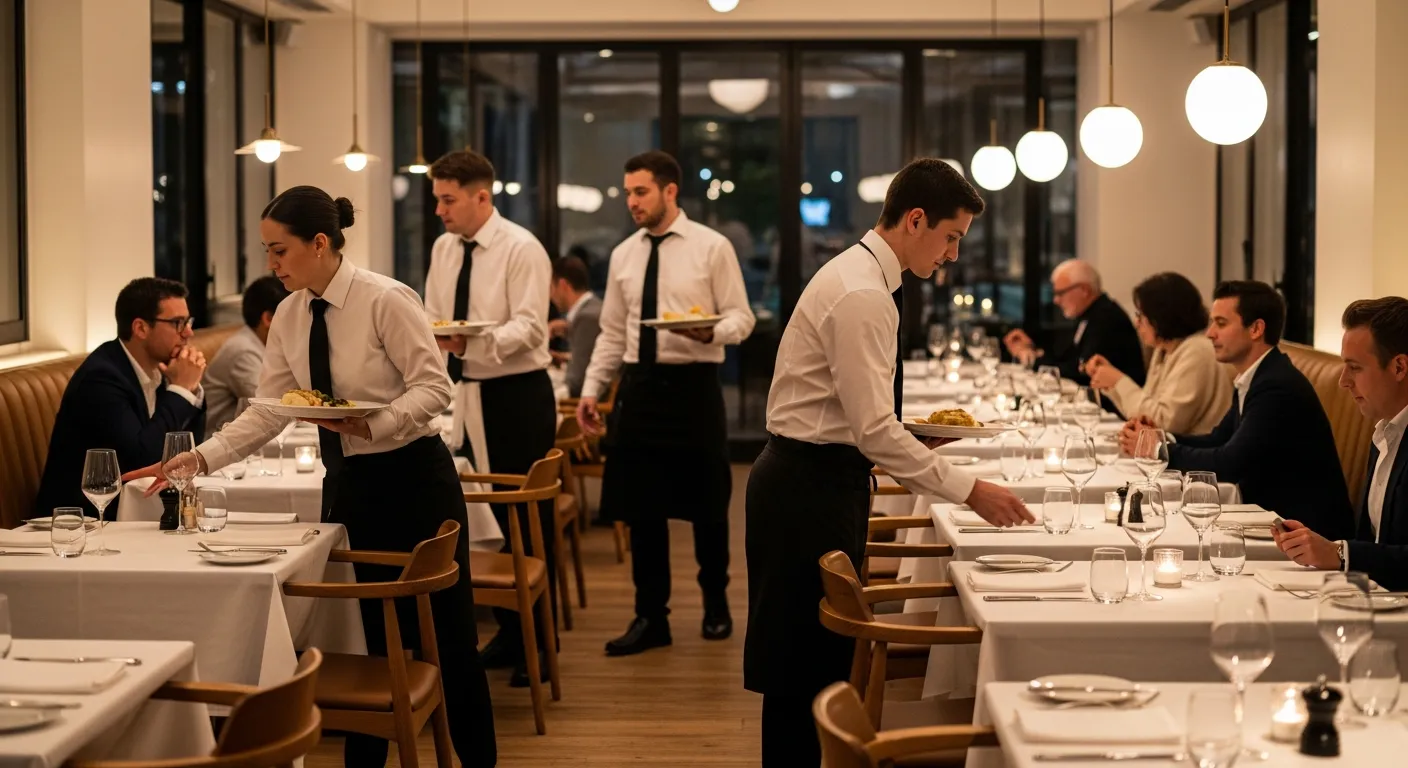
The goal of turnover optimization is never to rush guests. Rushed guests leave bad reviews, skip dessert, and don't come back. The goal is to eliminate dead time — the minutes between when a party could be seated and when they actually sit down, or between when a check closes and when the table is reset.

Where Dead Time Hides
- Seating delay: Table is clean but the host doesn't know it yet (avg 4–7 minutes lost)
- Pre-bussing gap: Guests are done but plates haven't been cleared, signaling "still dining" (3–5 minutes)
- Check delay: Server hasn't noticed the table is ready to pay (5–8 minutes)
- Reset time: Bussing and resetting without a standardized process (4–6 minutes)
- Party-size mismatch: Holding a 6-top for a 2-person walk-in "just in case" (15+ minutes wasted capacity)
A well-configured table management system with POS integration eliminates the first three automatically. When the server drops the check, the system flags the table as "closing." When payment processes, it changes to "needs bussing." When the busser marks it clean, the host stand gets an instant notification. Total dead time drops from 15–20 minutes to under 5.
Speed-Up Strategies That Don't Hurt the Experience
- Tableside payment: Handheld POS devices let guests pay without waiting for the server to run the card — saves 5–8 minutes per table
- Course-timed kitchen alerts: POS sends table status to the kitchen so apps are fired as guests are seated, not after the server walks back
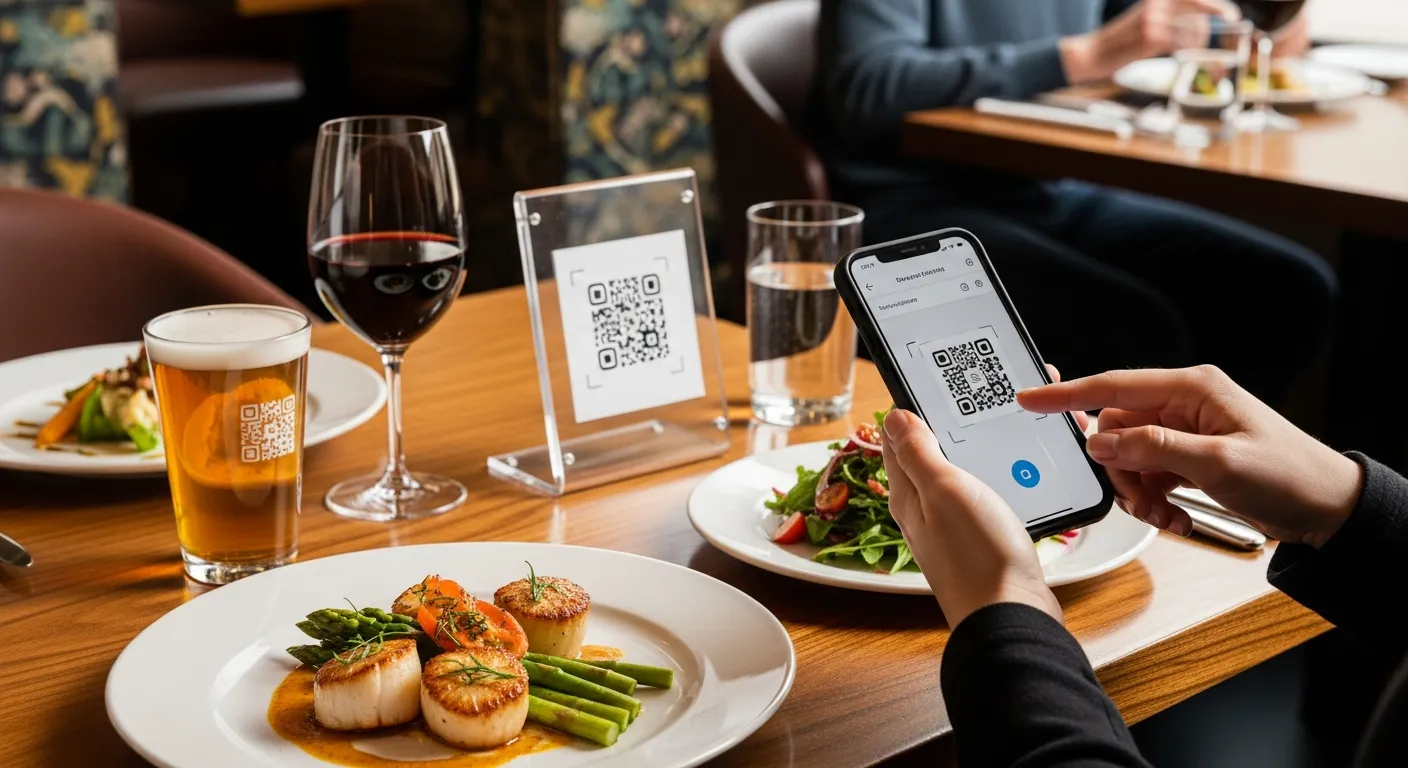
- QR code menus with pre-ordering: Guests can browse and order before the server arrives — cuts 4–6 minutes off seating-to-order time
- Automatic two-top merging: System suggests combining two empty 2-tops for a walk-in 4-top instead of waiting for the one 4-top to turn
- Real-time busser alerts: Kitchen display system shows which tables have closed checks, directing bussers proactively
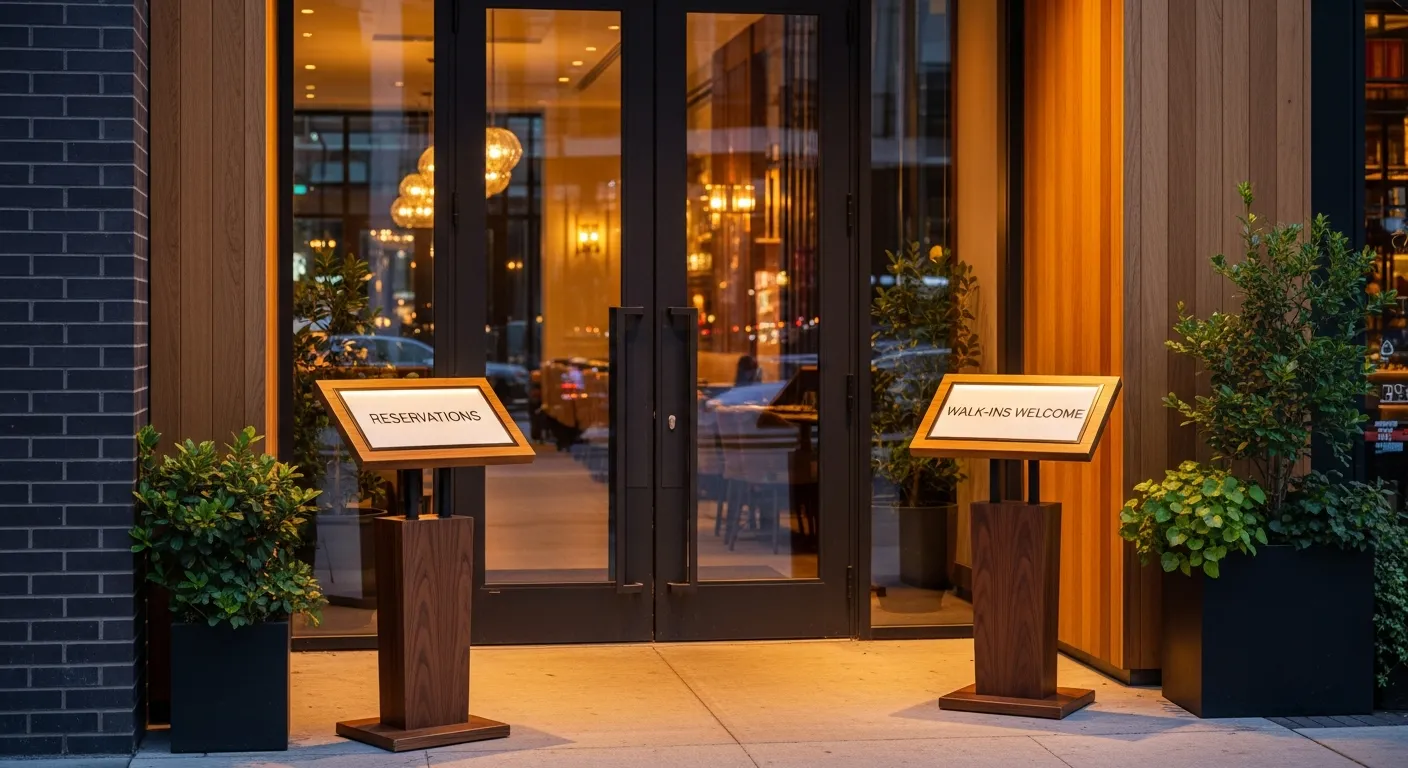
Reservations vs Walk-Ins: Finding the Right Balance
The reservation-vs-walk-in balance is the most debated question in front-of-house management. Too many reservations and you're vulnerable to no-shows, leaving empty tables during peak hours. Too few and you lose guests who want certainty, especially for special occasions.
Optimal Ratios by Restaurant Type
| Restaurant Type | Reservation % | Walk-In % | Buffer % | Why |
|---|---|---|---|---|
| Fine Dining | 80–90% | 5–10% | 5–10% | High check avg justifies holding capacity |
| Upscale Casual | 60–70% | 20–25% | 10–15% | Balance: predictability + spontaneous traffic |
| Casual Dining | 40–55% | 35–45% | 10–15% | Walk-in volume is the revenue driver |
| Fast Casual | 5–15% | 80–90% | 5% | Speed-based model, reservations rarely needed |
| Brunch / Weekend | 50–60% | 30–40% | 10% | Peak demand makes waitlists essential |
The "buffer" column is critical. This is capacity you hold back and release 30–60 minutes before the time slot, filling it with waitlist guests or late-booking walk-ins. It protects against no-shows while capturing last-minute demand.
No-Show Solutions That Actually Work
The industry average no-show rate is 15–20%. For a 100-seat restaurant with 2 turns, that's 30–40 empty seats per night — or roughly $1,000–$1,400 in lost revenue daily. Here are five strategies ranked by effectiveness:
- Two-way SMS confirmation (reduces no-shows 40–50%): Send "Reply C to confirm, X to cancel" 24 hours before. Unreplied reservations go to a "soft hold" list and can be released 2 hours before the slot.
- Credit card holds for large parties (reduces no-shows 60–70%): Require a card for parties of 5+ with a clear $25/person cancellation fee disclosed upfront. This alone cuts large-party no-shows dramatically.
- Waitlist backfill automation: When a cancellation comes in, the system automatically texts the next 3 waitlist guests with "A table just opened at 7:30 PM — reply YES to claim it." First reply wins.
- Strategic overbooking (advanced): Based on historical no-show patterns, book 10–15% over capacity for time slots with historically high no-show rates. Requires a good waitlist system as backup.
- Deposit-based reservations: For peak nights (Valentine's Day, Mother's Day, NYE), require a $50–100 deposit applied to the bill. No-show rates for deposit-backed reservations drop below 3%.
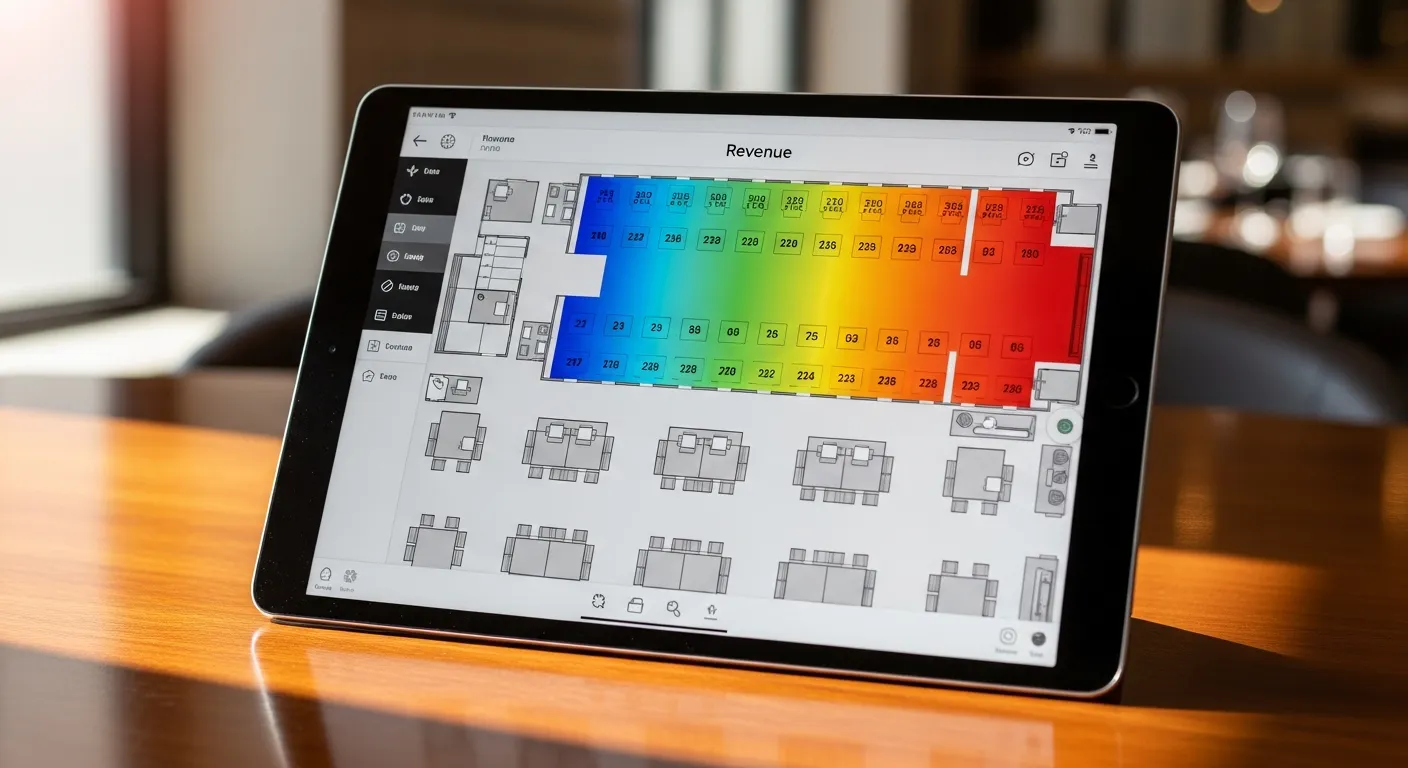
Floor Plan Optimization for Maximum Revenue
Your floor plan directly impacts RevPASH, server efficiency, and guest experience. Most restaurants design their floor plan once during build-out and never touch it again. That's a mistake — seasonal adjustments, party-size mix analysis, and traffic flow optimization can unlock 10–20% more capacity from the same square footage.
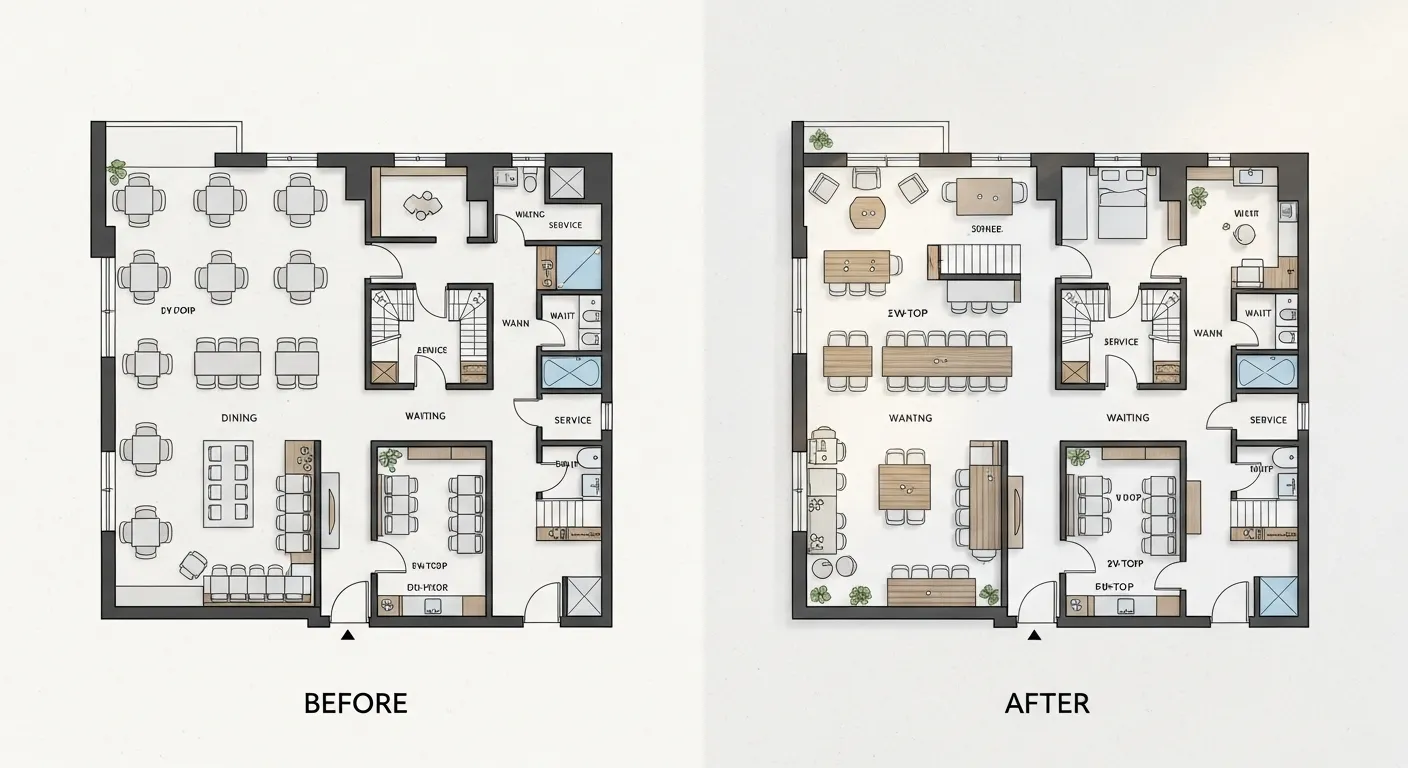
Key Floor Plan Principles
- Match table mix to party-size data: Pull 90 days of party-size data from your POS. If 45% of your parties are 2-tops but only 30% of your tables are 2-tops, you're losing turns to party-size mismatch.
- Flexible seating: Square 4-top tables that can be pushed together are more versatile than round tables. One large round table that stays empty half the night is a RevPASH killer.
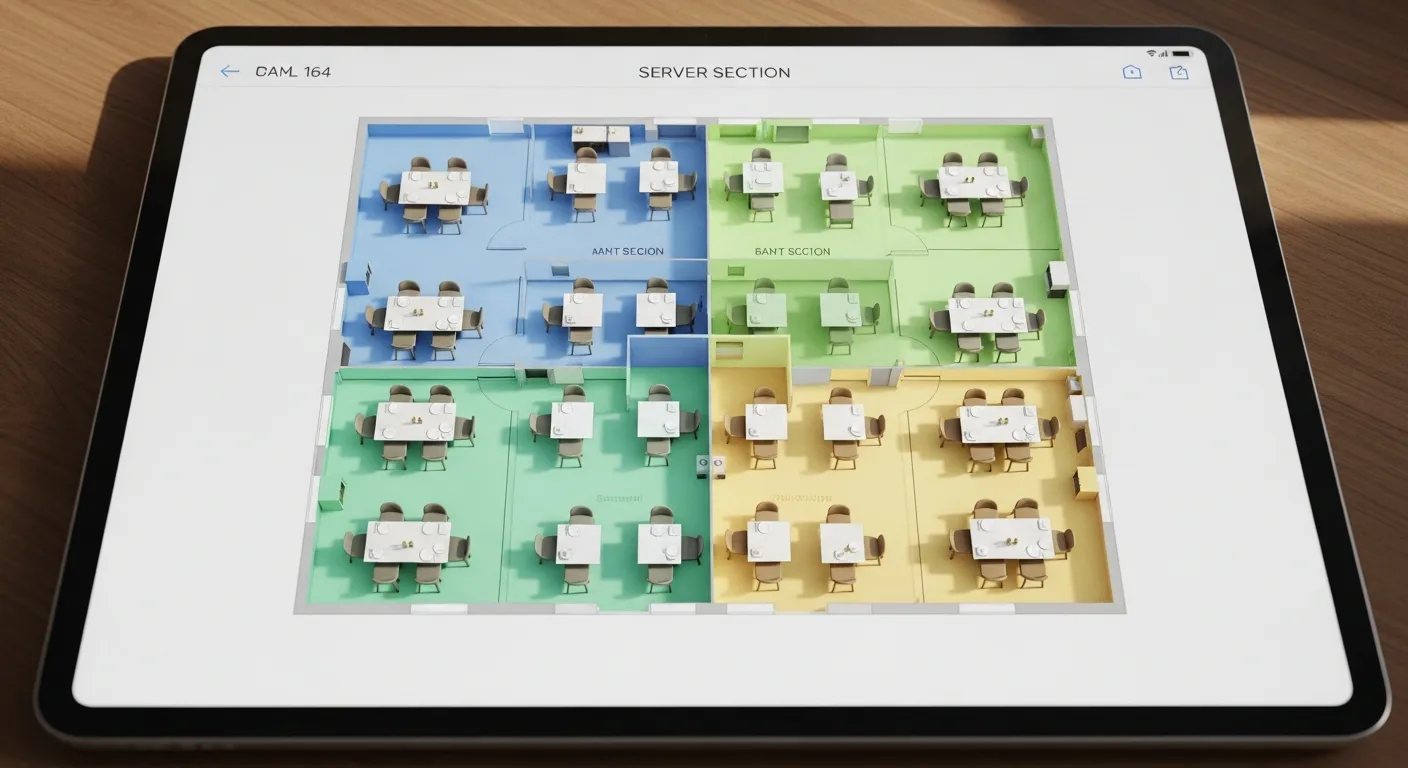
- Service zones: Group tables into server sections of equal revenue potential, not equal table count. A server with three 2-tops and one 6-top generates differently than one with four 4-tops.
- Traffic flow: The path from host stand to farthest table should never cross the kitchen door traffic or the bar service area. Guest traffic and staff traffic should be separate lanes.
- High-value positioning: Window tables and corner booths command longer dwell times and higher checks. Assign these to reservations, not walk-ins, and price prix fixe menus for these seats on special occasions.
Server Section Balancing
Unbalanced server sections are one of the top causes of staff turnover in restaurants. When one server consistently gets the "good section" (booths, large parties, high-turnover), tip disparities create resentment. Table management software with section-rotation algorithms solves this.
Section Assignment Models
| Model | How It Works | Best For | Drawback |
|---|---|---|---|
| Fixed Sections | Same server, same tables every shift | Fine dining (regular guests) | Tip inequality, favoritism |
| Rotating Sections | Sections rotate daily or weekly | Casual dining | Servers unfamiliar with different areas |
| Revenue-Equalized | Software assigns sections based on projected revenue, not table count | Any high-volume restaurant | Requires POS integration for revenue data |
| Hybrid Pickup | Core section + overflow tables assigned by the system when demand spikes | Variable-volume restaurants | Coordination complexity |
The revenue-equalized model — where sections are drawn so each server has roughly equal earning potential — reduces tip disparity by 30–40% and cuts server turnover measurably. KwickOS calculates this automatically based on historical per-table revenue data.
Why POS Integration Is Non-Negotiable
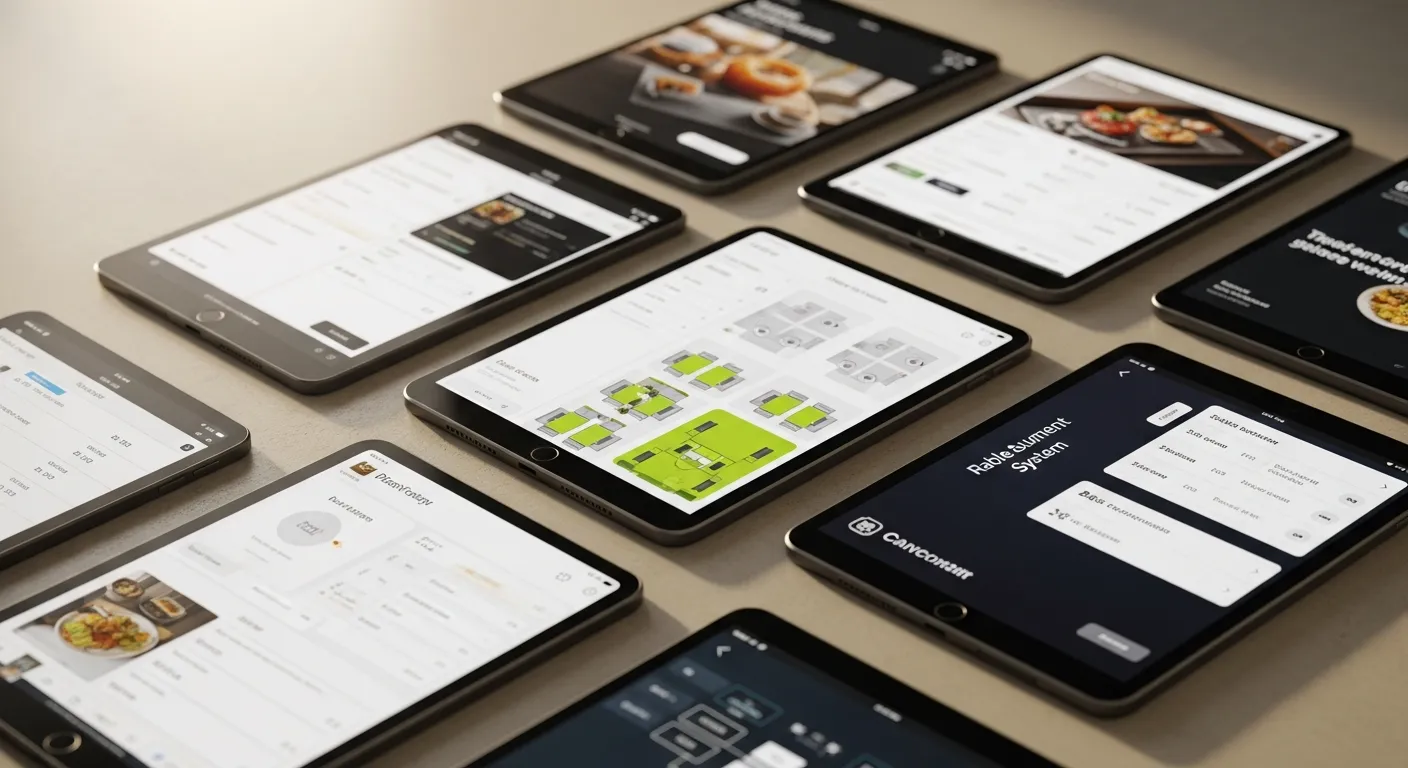
Standalone table management apps (OpenTable, Yelp Guest Manager, Resy) solve the reservation problem but miss the operational picture. They know who's coming and when — but they don't know what's happening at the table right now. That gap creates these problems:
- Inaccurate wait times: The host quotes 30 minutes because they see 5 occupied tables. But 3 of those tables already have their checks — the real wait is 10 minutes. Walk-in leaves.
- Double-seating: Two reservations get seated in the same server's section within 2 minutes because the table app doesn't know the server just got a complex 8-top order.
- Blind bussing: Bussers roam the floor looking for empty tables instead of being directed to tables that just closed their checks.
- No course tracking: The host can't tell the kitchen to hold Table 9's entrees because they're still on appetizers — the table app doesn't know course progress.

Platform Comparison: KwickOS vs OpenTable vs Yelp vs Toast
| Feature | KwickOS | OpenTable | Yelp Guest Mgr | Toast Tables |
|---|---|---|---|---|
| Monthly Fee | Included with POS | $149–$449/mo | $0–$299/mo | $50/mo add-on |
| Per-Cover Fee | $0 | $0.25–$1.00 | $0 | $0 |
| POS Integration | Native (built-in) | Limited (API) | None | Native (Toast only) |
| Real-Time Table Status | Automatic from orders | Manual host updates | Manual host updates | Automatic from orders |
| Floor Plan Editor | Drag-and-drop | Yes | Basic | Yes |
| Server Section Mgmt | Revenue-equalized | Basic assignment | No | Basic assignment |
| Waitlist + SMS | Yes, 2-way | Yes | Yes | Yes |
| No-Show Protection | CC holds + auto-backfill | CC holds | No | CC holds |
| RevPASH Reporting | Yes, real-time | Limited | No | Limited |
| Offline Mode | Full offline operation | No | No | No (cloud-only) |
| Multi-Language Support | English, Chinese, Spanish | English | English | English, Spanish |
| Annual Cost (80 seats) | $0 incremental | $6,000–$15,000+ | $0–$3,588 | $600 |
Table Management by Restaurant Type
Fine Dining (50–80 seats)
Priority: guest experience and pacing. Use timed reservation slots with 15-minute buffers between seatings. Assign VIP guests to preferred tables automatically. Track course pacing so the kitchen knows when to fire the next course. RevPASH target: $18–$40.
Casual Dining (80–200 seats)
Priority: turnover speed and walk-in capture. Implement waitlist SMS with accurate time estimates. Use tableside payment to cut 5–8 minutes per turn. Match table mix to party-size data. RevPASH target: $8–$18.
Fast Casual / Counter Service (40–100 seats)
Priority: self-service efficiency. QR code ordering eliminates server dependency. Table trackers (buzzer or digital number) let guests seat themselves. Focus on throughput, not turns. RevPASH target: $12–$22.
Bar / Lounge (30–60 seats)
Priority: high-value seat allocation. Bar seats turn fast but generate lower per-seat revenue than booths. Reserve booths for groups and bottle-service reservations. Use a separate waitlist for booth-only requests. RevPASH target: $10–$20.
Brunch Spot (60–120 seats)
Priority: managing the weekend crush. Limit reservation window to 50–60% of capacity. Stagger reservation times in 15-minute increments (not all at 10:00 AM). Use digital waitlist with walk-away alerts so guests can browse nearby shops instead of crowding the lobby.
Implementation Checklist
Use this checklist when setting up or upgrading your table management system:
- Pull 90 days of party-size data from POS and compare to current table mix
- Calculate current RevPASH for lunch and dinner service separately
- Set up digital floor plan with accurate table positions and seat counts
- Configure server sections using revenue-equalized or rotating model
- Enable 2-way SMS reservation confirmations (24 hours before)
- Set up credit card hold policy for parties of 5+
- Configure waitlist with automatic backfill notifications
- Integrate table management with POS for real-time table status
- Set up busser alerts triggered by check closure events
- Create separate floor plan profiles for patio season and events
- Train host staff on the 20-minute walk-away threshold
- Configure course-pacing alerts between FOH and kitchen
- Set up RevPASH reporting dashboard for weekly review
- Establish table turn time targets by day-part (lunch vs dinner)
- Enable QR code ordering for counter-service or fast-casual sections
5 Common Table Management Mistakes
- Holding large tables for walk-in large parties. A 6-top sitting empty for 45 minutes "just in case" costs you 2–3 turns of 2-tops. Set a policy: unreserved 6-tops convert to flexible seating after 15 minutes of vacancy during peak hours.
- Quoting pessimistic wait times to "manage expectations." Overquoting drives walk-aways. Guests who hear "45 minutes" and walk across the street are gone forever. Use real-time POS data for accurate estimates — and you'll keep 30% more walk-in guests.
- Using a standalone reservation app that doesn't talk to your POS. Manual table status updates are always late and often wrong. By the time the host marks a table "available," a walk-in has already left. Native POS integration eliminates this lag entirely.
- Ignoring the table-mix-to-party-size mismatch. If 45% of your parties are deuces but only 25% of your tables are 2-tops, you're seating couples at 4-tops and losing half the revenue potential of those seats. Run the data quarterly and adjust.
- Treating all time slots equally. Friday 7:00 PM and Tuesday 5:30 PM have completely different demand profiles. Reservation policies, staffing, overbooking thresholds, and table configurations should vary by day-part. A good system lets you create different rules for different slots.
Ready to Maximize Every Seat?
KwickOS includes table management at no extra cost — with native POS integration, real-time RevPASH tracking, and zero per-cover fees.
Call (888) 355-6996 for a Free DemoFrequently Asked Questions
RevPASH (Revenue Per Available Seat Hour) measures how much revenue each seat generates per hour. It combines table turnover speed with average check size into a single metric. Industry benchmarks range from $5–$8 for casual dining to $15–$25 for fine dining. Optimizing RevPASH typically increases total revenue 15–25% without adding seats.
Standalone table management software ranges from $0 (basic Yelp Guest Manager) to $449/month (OpenTable). Per-cover fees add $0.25–$1.00 per seated diner. POS-integrated solutions like KwickOS include table management at no extra monthly cost, eliminating per-cover fees entirely. For an 80-seat restaurant, the annual cost difference can exceed $15,000.
The optimal ratio depends on restaurant type: fine dining works best at 80–90% reservations, casual dining at 50–60%, and fast casual at 10–20%. Holding 15–20% of capacity for walk-ins during peak hours prevents empty tables from no-shows while capturing spontaneous traffic. Run your own data for 30 days to find your sweet spot.
Five proven strategies: (1) SMS confirmation 24 hours before, (2) credit card holds for parties of 6+, (3) two-way text confirmations requiring a reply, (4) waitlist backfill systems that auto-fill cancellations, and (5) overbooking algorithms based on historical no-show data. Combined, these reduce no-shows from 20% to under 5%.
Most standalone table management apps have limited POS integration. The best approach is a POS system with built-in table management — like KwickOS — which provides real-time order status on the floor plan, automatic table status updates when checks close, and server performance tracking. This eliminates the data gaps that cause double-seating and poor wait time estimates.
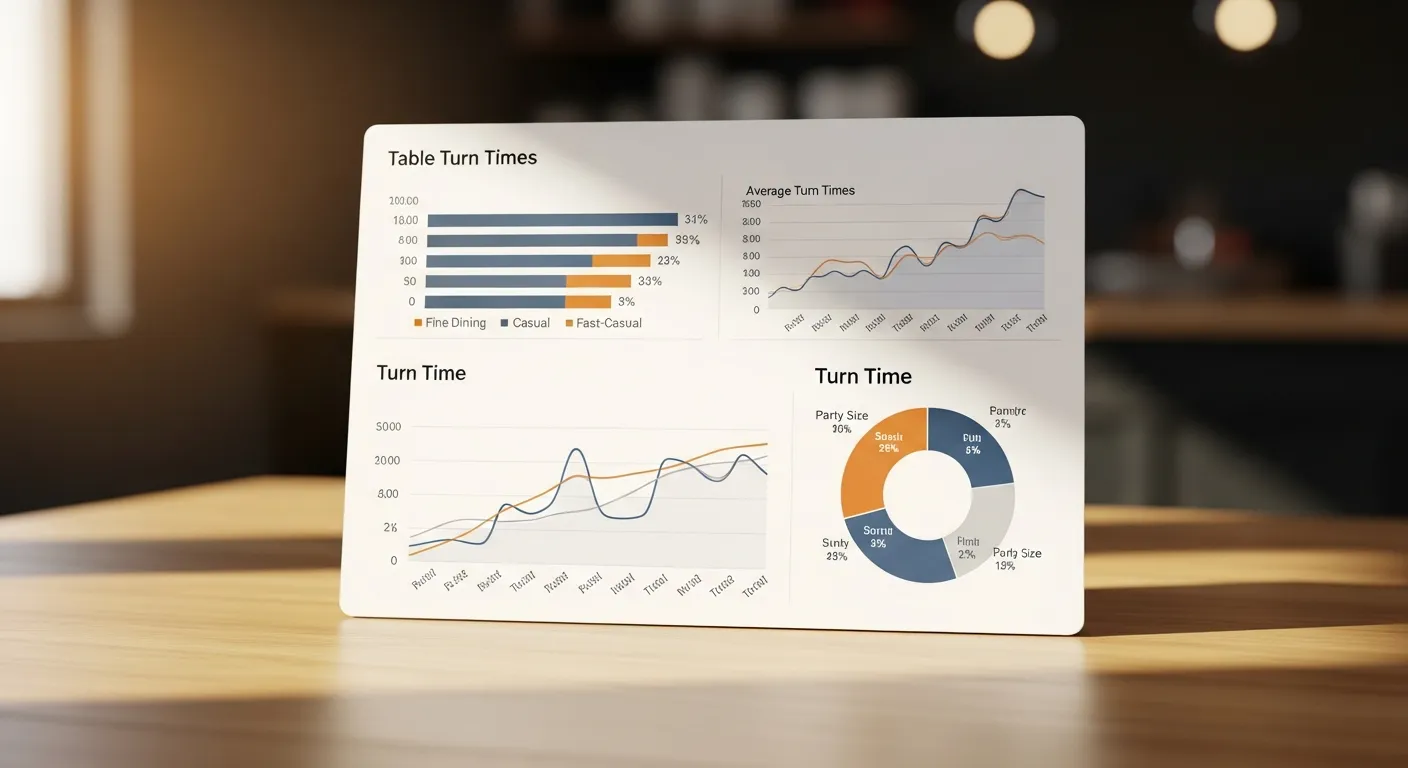
Industry averages: fast casual 20–30 minutes, casual dining 45–60 minutes, upscale casual 60–75 minutes, fine dining 90–120 minutes. Lunch turns 15–20% faster than dinner. The goal is not to minimize turn time but to optimize it — rushing guests hurts check averages and reviews.